Performing manual estimation
On the Interactive graphing page, the Reads table displays a list of the service point channels being graphed.
Note: If none of the channels in the table have an estimation set and validation set configured, the estimation and secondary validation cannot be performed. At least one channel must have estimation and validation sets to perform manual estimation.
Use the following procedure to manually estimate the plotted channels:
-
From the Actions menu (
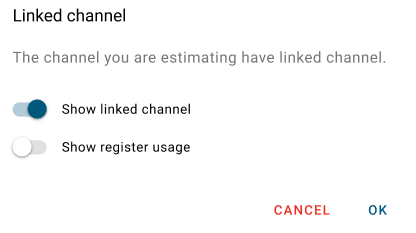
 ) on the card, select Manually estimate. If any of the interval channels in the table have linked register channels that are not listed in the table, the Linked channel dialog appears. If not, then the screen switches from view mode to estimation mode.
Note: You can plot a maximum of 10 channels on the Interactive graphing page.
By default, Show linked channels is enabled and Show register usage is disabled. To show register usage, toggle this option on.
-
Click OK to switch the screen to estimation mode.
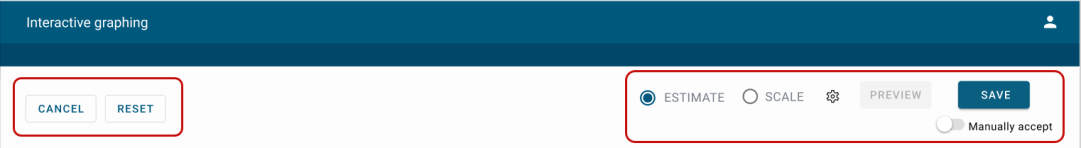
The following options appear at the top of the page:
-
Cancel. Cancels and disregards all changes on the page.
-
Reset. Resets all the changes on the page. By default, this option is disabled until you either cancel or preview the changes.
-
Estimate. Performs estimation for the data on the page. By default, this option is selected.
-
Scale. Scales the interval reads.
-
System Settings (
 ). Shows the name, value, and description for the relevant system settings:
-
Use Calculated Boundary Reads
-
Boundary Read Tolerance
-
Calculated Read Look Back
-
-
Preview. Performs the estimation and displays the results on the page.
-
Save. Saves all the changes on the page. By default, this option is disabled until you either cancel or preview the changes.
-
Manually accept. Saves changes to reads that failed validation. By default, this option is off. To enable this option, toggle this option on.
-
The page updates as follows:
-
In the table, the checkboxes for the service point reads that require estimation are selected and the suspect indicator (
 ) appears in the header. To include additional reads for estimation, select the checkbox for the read in the table. To select all the reads in the table, select the checkbox in the table header.
 -
On the graph, reads that are suspect (may require estimation) appear (in red) and the suspect indicator (
) appears beneath the graph. -
On the Channels card:
-
If a linked interval channel is selected, the suspect indicator (
) appears on the Channels table and Channels dropdown menu.
-
The Actions menu (
) next to each register read appears or disappears based on the option selected in the Channels dropdown menu (Use as start read or Use as end read). The Channels data updates to reflect the selection made and the corresponding boundary read shown beneath the start date or end date updates. Scaling is performed using these updated boundary reads.Note: This is only applicable to register channels that have linked interval channels, not standalone register channels or interval channels.
-
To view boundary reads for a different date range, change the start and end date. The corresponding boundary reads beneath the date range updates, and scaling is performed using the updated boundary reads.
-
-
Click Save to save all the changes. The Save dialog appears showing the status of the reads.
-
For reads that passed the validation, the Pass (
 ) validation status appears on the dialog.
 -
For reads that failed the validation, the Fail (
 ) validation status appears on the dialog. To manually accept the failed reads, toggle Manually accept (at the top of the page) to on, and then click Save.
-